The Bryn Report
Bryn Report

Bryn Report
There is low inventory nationally and locally and it is a condition that is not going away anytime soon. There are a myriad of reasons for the low inventory, but one thing all economists agree on is that it is not easily remedied.
The single largest contributing factor is the wide spread existence Golden Loans or loans which are fixed at under 4%. According to the research firm Black Knight, 72% of homeowners, have mortgages under 4%, with 55% having rates under 3.5% and 34% having loans at under 3%.
These homeowners are not going to sell their homes unless they have a very compelling reason to do so. And the resistance to selling increases each time interest rates rise. Further, 90% of these homeowners are in 30- year loans, meaning we will not have a significant number of properties with readjustments hitting after 5 and 7 and 10 years.
A second factor limiting inventory is the tax basis. Not only do homeowners have extremely favorable mortgage rates, they also have favorable property taxes because in CA, property taxes are calculated off of your purchase price and they can only go up 2% a year thanks to Prop 13.
A third reason limiting inventory is the access to capital homeowners enjoy through HELOC loans (home equity lines of credit). One of the reasons people sell is to access their capital in the form of equity in their properties. In December of 2010, the average US homeowner had a little over 72% of debt on their homes…today that number is a little over 42%. Homeowners are sitting on record equity right now, and the ability to draw on that in the form of a HELOC is at an all-time high.
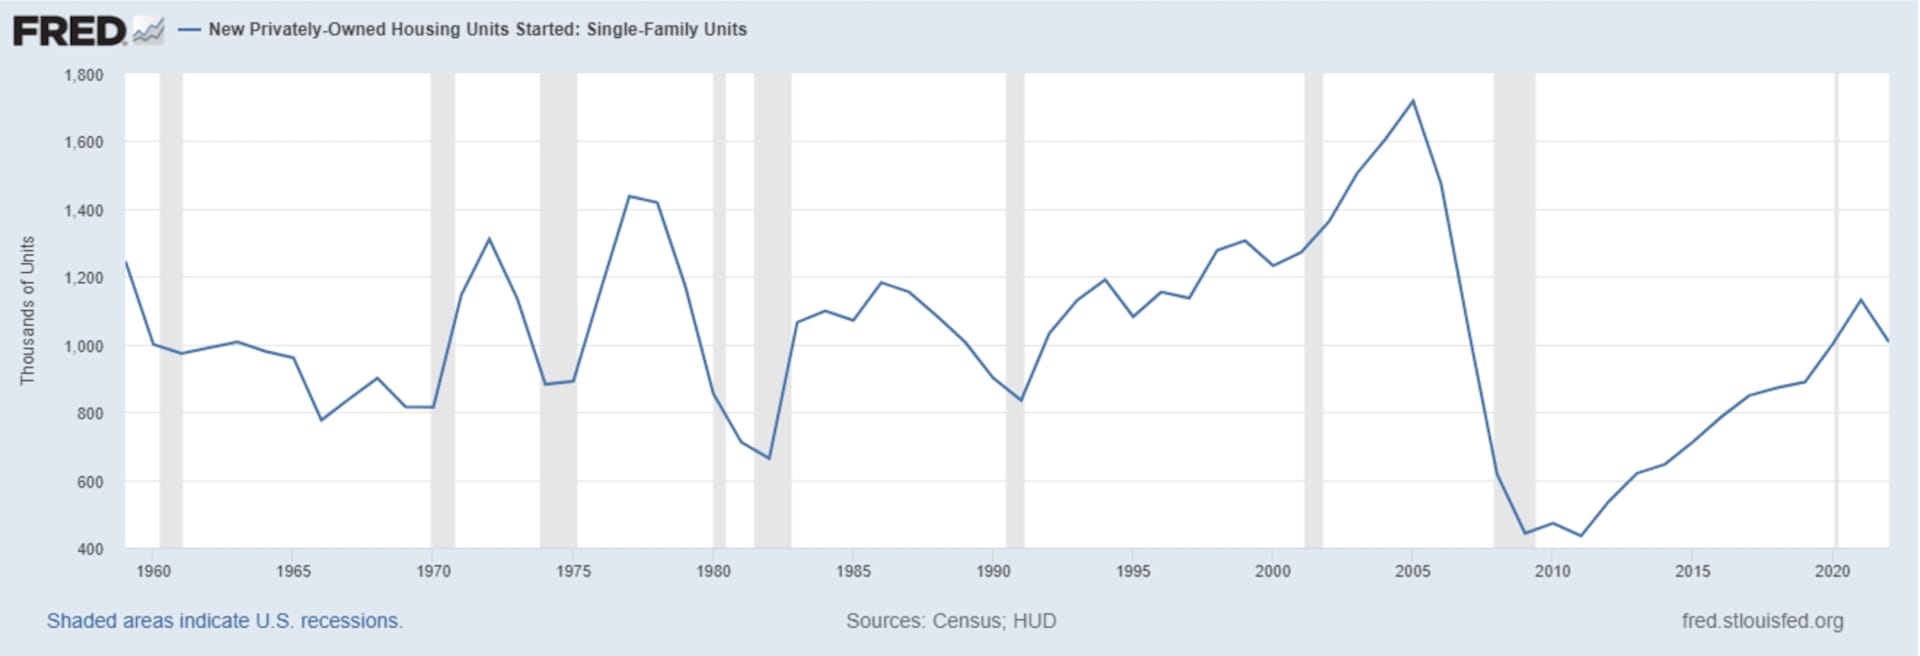
There are other reasons that are preventing new inventory from hitting the market in numbers adequate to meet demand. Rising materials costs, supply chain issues, low builder confidence, rising rents and labor shortages stemming from COVID have all negatively impacted housing inventory. But the problem existed long before the pandemic. Essentially, the U.S. has failed to keep up with the housing demands of a continually increasing population. (Particularly when it comes to millennials, a huge demographic who are now at prime homebuying age.) The following graph tracks national single family housing starts and shows just how far behind demand the housing market is. In the 1990’s, we saw 10.145m housing starts and added 29m people to the population over the decade. In the 2000’s we saw 12.734m housing starts and added another 30m to the population over the decade. In 2011-20, we added only 7.34m new homes despite another 20m jump in population. We are chronically undersupplied.
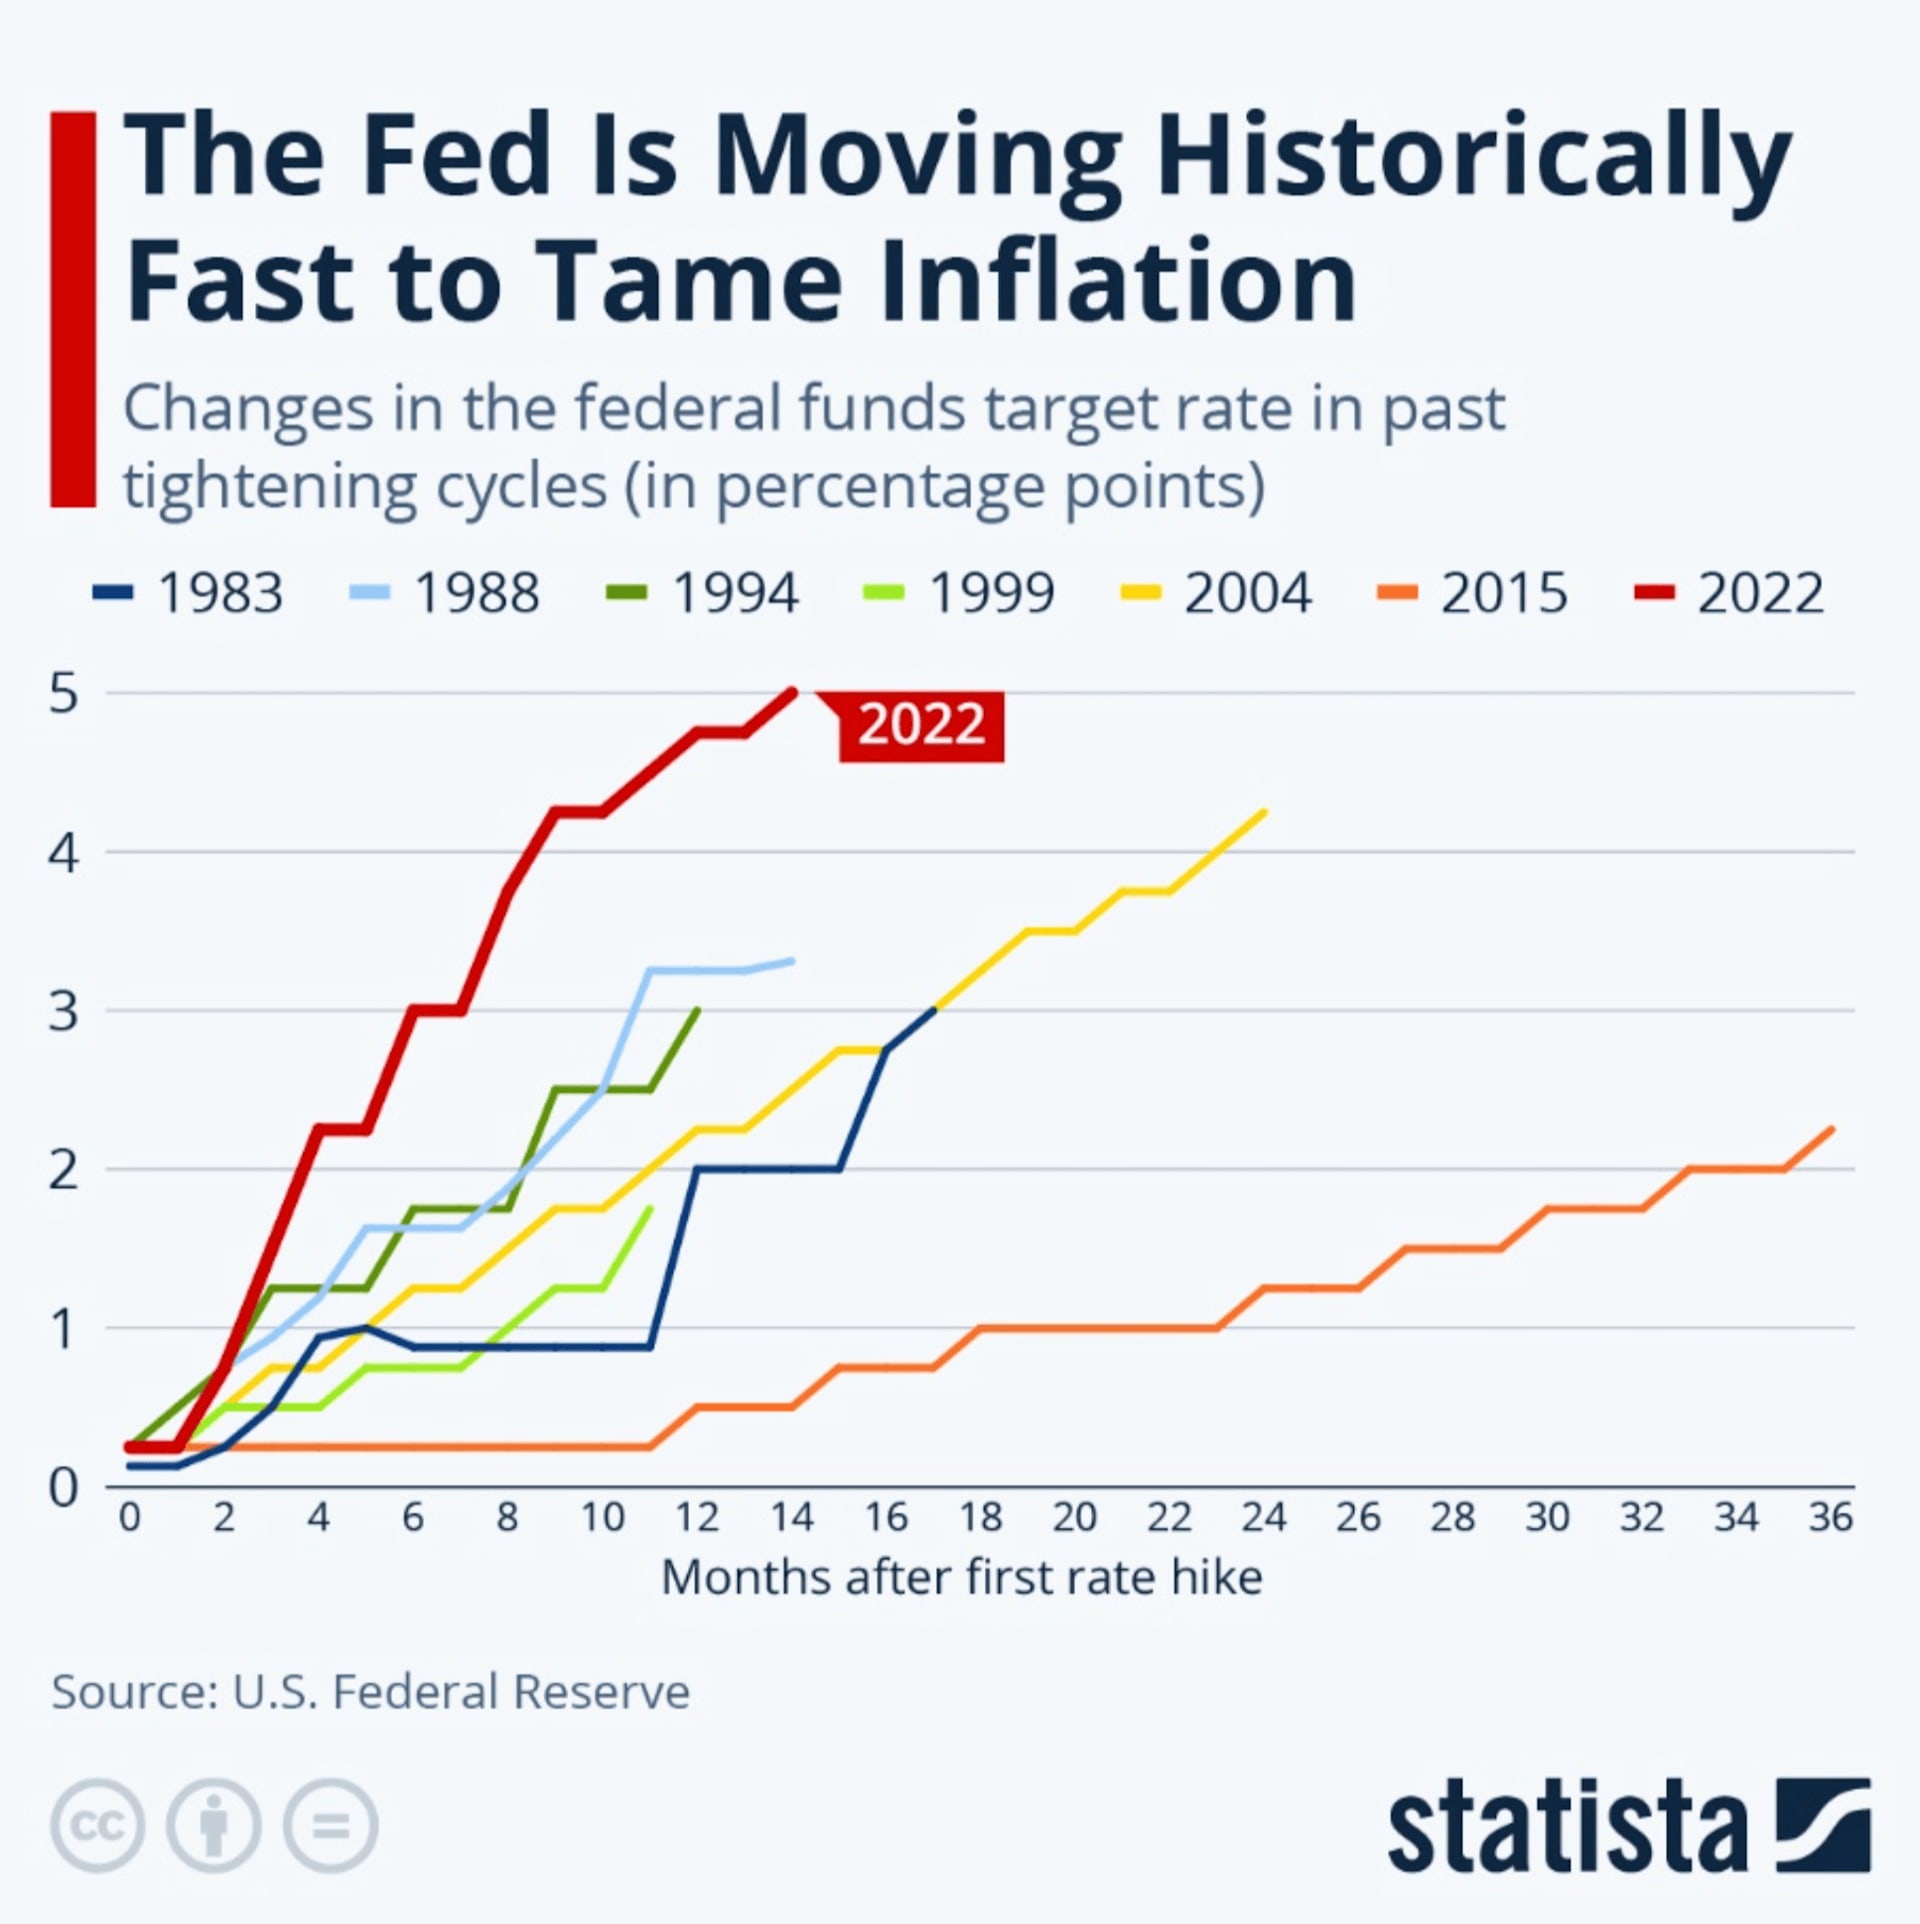
There are many headwinds to demand, but none has hit harder than the Feds aggressive posture on raising interest rates. For the first time in history, the Feds doubled rates inside of a 12 month period.
This has crushed affordability, significantly slowed appreciation and dramatically decreased the number of Transactions. In CA, the number of transactions year over year, is off 23% as of January of ’23 to nearly 2007 levels. In Los Angeles, according to the California Association of REALTORS®, the number of sales is down 34.2% from a year ago, but up 39.1% from a month earlier suggesting buyers may be coming back into the market.
That kind of dramatic drop off in number of transactions would normally crush markets, but because of the historic low inventory levels, what we have seen state wide, is a slight decrease in some markets with the Bay area up north getting hit the hardest, and other markets being even or slightly up.
It looks like the second half of ’23 will be better than the first with regard to number of sales but what effect will a looming recession have on the market.
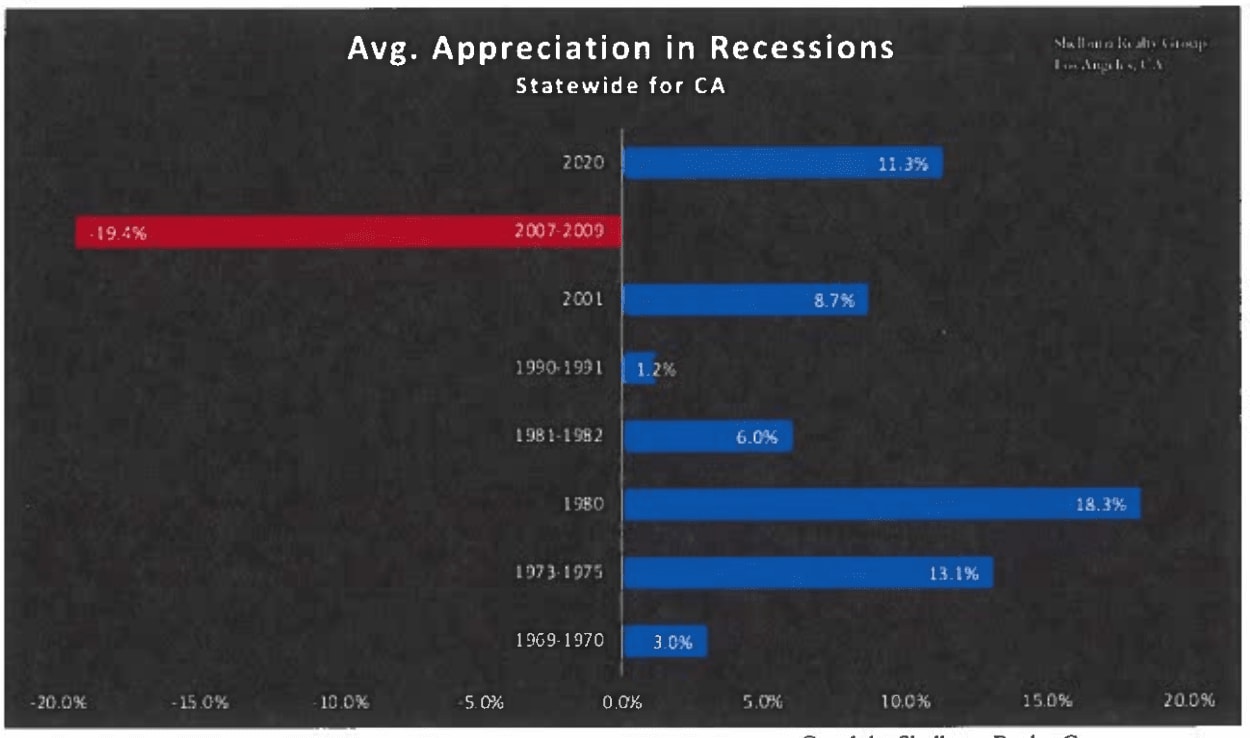
Depending on who you talk to, we are either in a recession, have been in a recession or are looking at going into a recession. Those are intuitively worrisome words, but it may surprise you to hear that most of the time… real estate appreciates during a recession. In CA, we have had 8 recessions since 1968. In 7 of the 8 recessions, property has appreciated in CA. The one exception is the Great Recession of 2008-2010 in which we saw property values retreat in some cases up 25% to 30%. In the beach cities, our recession record is almost as good. Prices have appreciated in 6 of the last 8 recessions, with 1991/’92 being the only other recession outside the Great Recession to see values retreat. Statewide the ‘91/’92 recession was triggered by a lending crisis that saw many Savings and Loans close, but that was coupled locally with severe downsizing in aerospace and defense that accompanied the “End of the cold war”…and that combination hit the beach cities pretty hard.
In the rest of the recessions, value moved up. There are several reasons for this but one of the primary drivers are interest rates. The Fed eases interest rates during recessions and that traditionally has a positive influence on values. In this case, the Fed will have caused the recession by keeping interest rates so low for so long, that they had to take drastic measures to raise interest rates to tamp down 40 year highs in inflation. There are many differences between this recession and the great recession, but perhaps the most significant for real estate values is this recession is marked by extremely low inventory.
If history repeats itself, and most economists think it will, the Fed will at some point begin to loosen the reign on interest rates to encourage the economy to start to grow again, and when they do demand will rebound, but in a restricted inventory market.
The Trees
New Construction in the Tree Section at near record lows with only four new construction homes slated to hit the market this year… tying post pandemic 2021 as the lowest year in the last decade.
New Home Spec Construction by Year
2023 4 2017 12
2022 9 2016 15
2021 4 2015 9
2020 11 2014 8
2019 13 2013 5
2018 21
Of the 9 sales in 2022, the low was $3.820m at 3408 Maple ( it just re-traded at the same number in March), the high was 2100 John at $6.45m (with higher back up offers) and notably 5 of the 9 sales were over $5m. The two new construction sales to trade this year sold at $5.425m (901 28th Street) and $6.325m (644 29th Street) respectively. As per usual, demand for new construction far outpaces the supply. The demand for buildable lots will remain strong as a result.
The Hill
Perhaps the rarest of all properties in Manhattan Beach is the large home, large lot, ocean view estate properties in the Hill Section. For the third time (and the second time in the last 16 months) a Hill Section estate topped the $20m mark in the 4th quarter of ‘22. That means that three of the four highest residential sales ever in Manhattan Beach reside in the Hill Section. As of this writing, we have one large buildable lot 9,982s.f. lot at 700 John on the market for $10.5m, a large estate property at 908 Pacific for $13.99m that features an 8,528s.f. home on a 12,000s.f. lot, an 8,389s.f. big view estate home on a 10,128s.f. lot at 500 N. Poinsettia. It is a rare thing to have one of these types of properties so to have three is notable. There are also two large lot/ lot with homes in escrow with 931 1st Street, a 9,595s.f. buildable lot in escrow with a $6.2m ask, as well as 501 John St., which featured a 5,724 s.f. home on a 10,620s.f. lot which went under contract quickly with a $10.5m ask after only 10 days on the market. If you are looking for a large ocean view estate style property, you won’t find a deeper field than we have right now.
East MB
East Manhattan which consists of the Liberty Village/ Manhattan Heights area and the Mira Costa section continues to be one of the healthier submarkets markets at the beach. With 11 properties on the market and 11 in escrow, it has a Manhattan Beach low of 30 days of inventory. That is going to continue to put upward pressure on pricing. In both beach cities recessions where we saw real estate values pull back… (‘91/’92 and ‘08-’10), it was East Manhattan Beach that lead the charge in both instances. The recovery started in East MB and then swept west hitting the Strand last. For it to happen once is interesting, but for it to repeat again means there is something else going on. My theory has been East MB, because of the larger uniform lot sizes, is perhaps more familiar to people moving in from other areas than say the Tree Section and Sand section and as a result… has more appeal to buyers coming in from other areas which results in slightly greater demand from buyers who are clearly “need based” buyers. No matter what the reason, East MB has and continues to be an area that performs well when things get stormy and that stable platform in stormy seas seems to be an enduring feature.
If you have a specific question about your property or your area, feel free to reach out.
- Bryn Stroyke

May 2023 Monthly Market Update
A home built for entertaining . . . This luxury residence is coming soon to the East Manhattan Beach real estate market. Listed by Bryn Stroyke of The Stroyke Propert… Read more

COMING SOON! Nantucket Inspired Manhattan Beach Hill Section Home Listed by Bryn Stroyke of the Stroyke Properties Group at Bayside Real Estate Partners, this home… Read more

Manhattan Beach Real Estate Meets Mid-Century Modern 600 Anderson is a mid-century find in the Hill Section of Manhattan Beach This updated and re-finished home showca… Read more
You’ve got questions and we can’t wait to answer them.